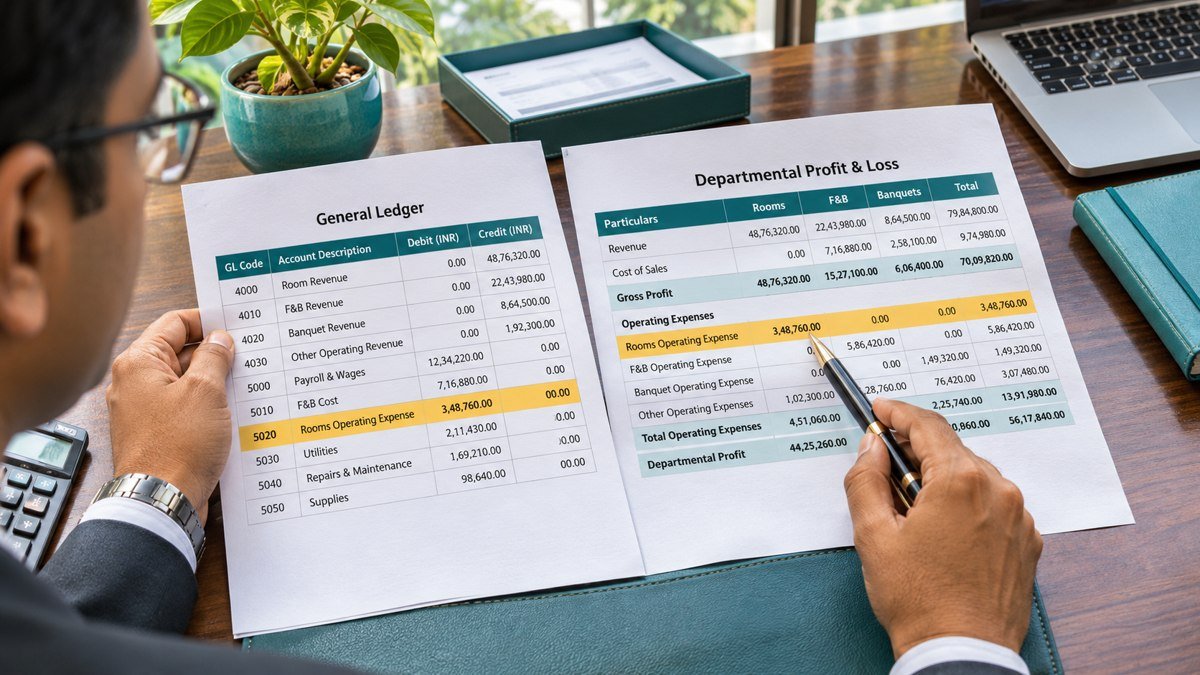
Hotel P&L variance analysis compares actual results with the budget and explains what moved profit. In this worked example, room sales and restaurant revenue beat budget by a combined ₹2,50,000, but operating costs rise by ₹3,00,000. The hotel finishes ₹50,000 below its operating profit target. The worksheet shows where the shortfall came from and gives the finance team a starting point for the month-end review.
1. Compare the same period and accounts
Start hotel P&L variance analysis with the closed general ledger and the approved monthly budget. Confirm that both reports use the same property, operating dates, departments and account mappings. Compare net revenue with net revenue, and check that budgeted costs and ledger costs include the same items. If the budget groups overtime into payroll, either combine the actual payroll lines for comparison or use the approved budget detail to split them. Record the mapping so another reviewer can repeat the calculation.
Check late supplier invoices, payroll accruals and reversals before explaining a variance. For example, agency labour used on the final weekend belongs in that month’s cost review even if the invoice arrives after close. Review the posting with the person responsible for the close and keep the evidence with the worksheet. The Hotel Finance Toolkit includes a month-end close template for tracking open items and owners.
2. Build the hotel P&L variance analysis worksheet
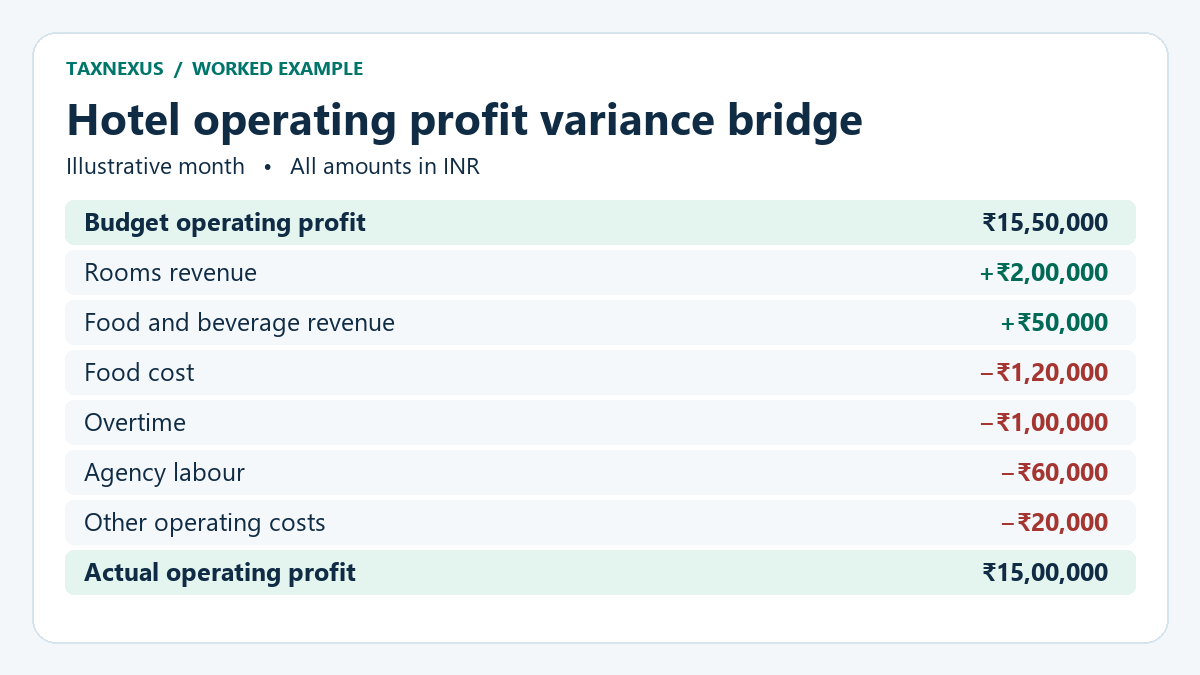
This simplified example uses fictional figures for one hotel and shows operating profit as operating revenue less the expenses listed. Financing and income tax are outside the example. The last column shows the impact on profit. Calculate revenue variances as actual less budget, and expense variances as budget less actual. With this convention a positive number is favourable and a negative number is unfavourable. Oracle’s variance reporting documentation uses this same sign convention.
| Line item | Budget | Actual | Profit impact |
|---|---|---|---|
| Rooms revenue | ₹40,00,000 | ₹42,00,000 | +₹2,00,000 |
| Food and beverage revenue | ₹20,00,000 | ₹20,50,000 | +₹50,000 |
| Total revenue | ₹60,00,000 | ₹62,50,000 | +₹2,50,000 |
| Food cost | ₹6,00,000 | ₹7,20,000 | −₹1,20,000 |
| Regular payroll | ₹12,00,000 | ₹12,00,000 | ₹0 |
| Overtime | ₹1,00,000 | ₹2,00,000 | −₹1,00,000 |
| Agency labour | ₹50,000 | ₹1,10,000 | −₹60,000 |
| Other operating costs | ₹25,00,000 | ₹25,20,000 | −₹20,000 |
| Total operating costs | ₹44,50,000 | ₹47,50,000 | −₹3,00,000 |
| Operating profit | ₹15,50,000 | ₹15,00,000 | −₹50,000 |
The margin is operating profit divided by revenue. Here it falls from 25.83% to 24.00%, a drop of 1.83 percentage points. For a line-item variance percentage, divide the signed variance by the absolute budget amount. When the budget is zero, report the amount and mark the percentage as unavailable. Review both the absolute amount and the percentage so a small percentage on a large cost line still gets attention.
3. Separate activity from price and cost
Room nights increase from 1,000 to 1,050 at the same average rate of ₹4,000. The 50 extra nights explain the ₹2,00,000 gain. In a real hotel P&L variance analysis, compare room nights and average daily rate by segment. A change in the share of group, corporate or online bookings can move the average rate even when individual rates stay the same. Use the rooms report and the ledger to confirm the two totals agree before attributing the change.
For the food-cost calculation, assume the example’s F&B revenue is all food sales and the cost line covers that same scope. The budget ratio is ₹6,00,000 ÷ ₹20,00,000 = 30%. At actual sales of ₹20,50,000, a budget that adjusts for activity allows ₹6,15,000 at that ratio. The extra sales explain ₹15,000 of the ₹1,20,000 cost overrun, leaving ₹1,05,000 above the adjusted benchmark. Check menu mix, ingredient prices, recipe yields, waste logs and inventory adjustments to explain the remaining difference.
4. Tie overtime and agency costs to shifts
Overtime and agency labour together are ₹1,60,000 above budget even though regular payroll is on budget. Compare approved rosters and time records with actual hours, wage rates and agency invoice dates. Ask department heads which shifts needed extra coverage, whether the higher demand was planned and which vacancies had to be covered. Assign the cost to the department and date where the hours were worked. Keep invoice timing differences separate from recurring staffing issues in the explanation.
5. Turn the variance bridge into a management note
Operating profit was ₹15,00,000, or ₹50,000 below budget. Revenue was ₹2,50,000 above plan, including ₹2,00,000 from 50 additional room nights at the budgeted average rate. Higher food cost, overtime, agency labour and other costs reduced profit by ₹3,00,000. Food cost was ₹1,05,000 above the benchmark adjusted for actual food sales. The F&B controller will review the five largest ingredient and usage variances. Department heads will match extra shifts to rosters and agency invoices before the next forecast.
A monthly hotel P&L variance analysis should leave each major line with an amount, a supported explanation, an owner and a review date. Keep the worksheet, source reports and comments together. If a driver is still unconfirmed, record the evidence needed and who will obtain it. At the next review, check whether the corrective action reduced the cost or whether the forecast should reflect a recurring change.
Keep one record per variance
For each material variance, record the account, department, budget, actual, signed profit impact, cause, source report, action owner and due date. If the cause is unconfirmed, add the next test. For example, the purchasing team can compare the latest supplier invoices with the budgeted unit prices, and the kitchen team can check whether portions or menu mix changed.
Before distributing the hotel P&L variance analysis, total the signed impacts and reconcile them to the change in operating profit. Review year-to-date results separately so a late invoice or a one-month event does not obscure a continuing trend. Where the cause recurs, record whether the next forecast assumes the same rate, volume or staffing pattern.
Frequently asked questions
Why can revenue beat budget while operating profit falls?
Extra revenue helps only to the extent it exceeds the additional operating costs. Here ₹2,50,000 of extra revenue is offset by ₹3,00,000 of extra cost, reducing profit by ₹50,000.
Which variances should management review first?
Start with large amounts, repeated overruns and items that affect the forecast or require an operational decision. Review smaller items when they point to a control problem, such as unapproved agency shifts or expenses posted to the wrong month.